Linking Slot Reel Volatility to Accumulator Tactics on Hybrid Betting Platforms
Written by Henrik Braun · Jul 10, 2026
Linking Slot Reel Volatility to Accumulator Tactics on Hybrid Betting Platforms
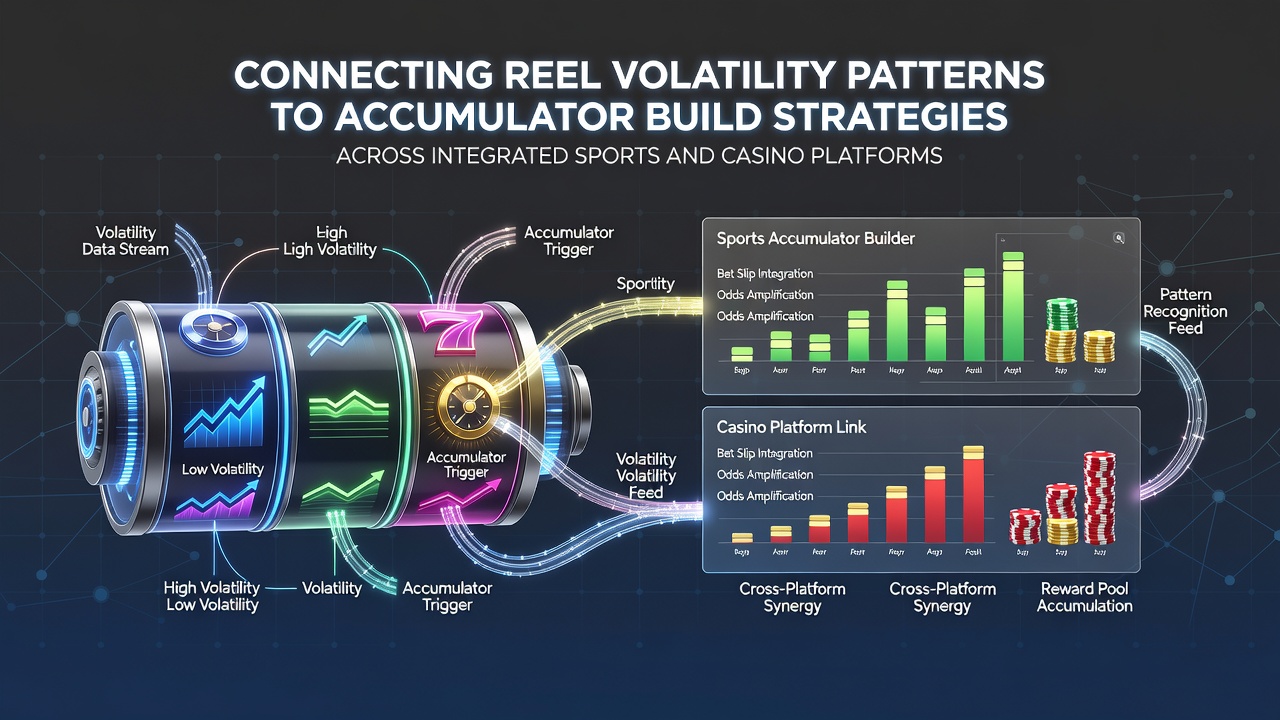
Integrated platforms that combine sports betting with casino offerings have created new opportunities for users to apply volatility analysis from slot reels directly to accumulator construction, and this crossover draws on observable payout patterns that appear across both verticals. Reel volatility measures the frequency and size of slot payouts, with high-volatility titles producing infrequent but substantial returns while low-volatility options deliver steadier smaller wins, and these same risk-reward dynamics map onto accumulators where multiple legs increase potential returns alongside overall loss probability.
Core Elements of Reel Volatility Patterns
Slot volatility stems from the underlying random number generator mechanics that determine symbol alignment rates across paylines, and platforms track these metrics through return-to-player percentages alongside hit frequency data. Researchers have documented how variance in reel behavior follows predictable distributions over large sample sizes, allowing patterns such as clustered high-payout sequences or extended dry spells to emerge in historical logs. Those who study these distributions note that volatility indexes published by game providers offer standardized references, yet actual session results still fluctuate based on individual stake levels and bonus feature triggers.
Data from multiple operators indicates that players often select high-volatility slots during periods when they seek larger single payouts to offset other activity, and this selection tendency parallels accumulator usage in sports where bettors combine selections for amplified odds. Medium-volatility games occupy the middle ground, producing balanced outcomes that some users employ to maintain session length without extreme swings, which mirrors the construction of accumulators with mixed-risk legs drawn from different sports or leagues.
Accumulator Construction and Risk Correlation
Accumulators require users to link multiple independent outcomes into a single wager, multiplying odds while compounding the chance that any single leg fails and voids the entire ticket. Observers have recorded how bettors adjust leg counts based on confidence thresholds, typically limiting selections to three or four when targeting moderate multipliers and expanding to six or more during promotional periods that offer boosted returns. Platform analytics reveal seasonal spikes in accumulator volume during major tournaments, with average leg numbers rising in correlation to perceived value in underdog selections.
Studies from industry groups such as the American Gaming Association show that accumulator participation rates remain steady even as individual bet sizes vary, suggesting users treat these wagers as distinct from single-match plays. Volatility in this context appears through the distribution of winning versus losing tickets, where longer accumulators exhibit higher variance in payout outcomes similar to high-volatility reels that deliver rare jackpots amid frequent small losses.
Cross-Platform Strategy Integration
Unified accounts on hybrid sites allow seamless movement between casino reels and sports accumulators, and operators have introduced tools that display volatility ratings alongside accumulator builders to facilitate pattern-based decision making. Users can review historical reel performance data before constructing a multi-leg ticket, applying filters that match volatility tiers to expected accumulator risk levels. This integration has expanded since mid-2025, with several major platforms adding dashboard widgets that overlay slot variance graphs onto sports event calendars.
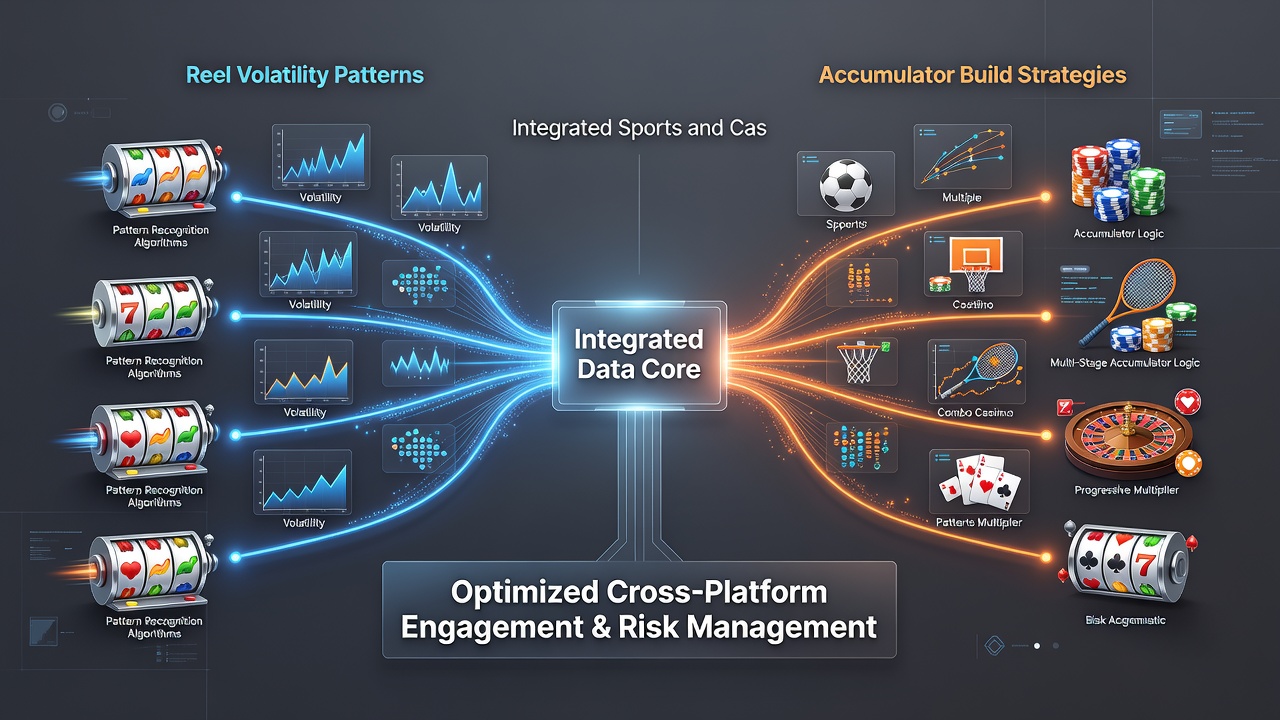
Platform records from July 2026 indicate increased usage of volatility-matching features during major sporting events, where users pair high-volatility slot sessions with longer accumulators to balance session variance. European regulatory reports compiled by the European Gaming Regulators Association note similar trends across licensed operators, with data showing that integrated tools correlate with higher average session durations compared to siloed product access. Those analyzing user flows find that the ability to switch between verticals without account changes supports more deliberate risk calibration across both casino and sports products.
Observed Patterns and Platform Data Trends
Transaction logs across hybrid environments reveal recurring sequences where periods of elevated slot volatility coincide with shifts toward higher-odds accumulators, and this alignment appears in aggregate statistics rather than individual sessions. Game providers release volatility indexes that operators incorporate into recommendation engines, while sports data feeds supply comparable variance metrics for team performance and match outcomes. Users who combine these data streams often adjust accumulator length after reviewing recent reel payout distributions, creating a feedback loop between the two product types.
Academic examinations of betting behavior, including work from the University of Nevada's International Gaming Institute, have identified statistical overlaps between slot variance distributions and accumulator win-rate curves, particularly in datasets exceeding one million transactions. These overlaps manifest as similar standard deviation values when normalized for stake size, suggesting transferable risk assessment methods across verticals. Platform developers have responded by embedding comparative volatility calculators that normalize metrics from both slots and sports into a shared scale.
Conclusion
Platform integration has enabled direct application of reel volatility analysis to accumulator construction, with observable correlations in risk profiles and payout distributions across both product categories. Data sets from operators and research bodies continue to document how users leverage these connections through unified interfaces, and standardized volatility metrics support more consistent strategy alignment. Continued tracking of transaction patterns will clarify the extent of these relationships as hybrid platforms evolve their analytical tools.