Mapping Bonus Thresholds Against Return Metrics in Multi-Vertical Wagering Ecosystems
Written by Tina Schwarz · Jul 13, 2026
Mapping Bonus Thresholds Against Return Metrics in Multi-Vertical Wagering Ecosystems
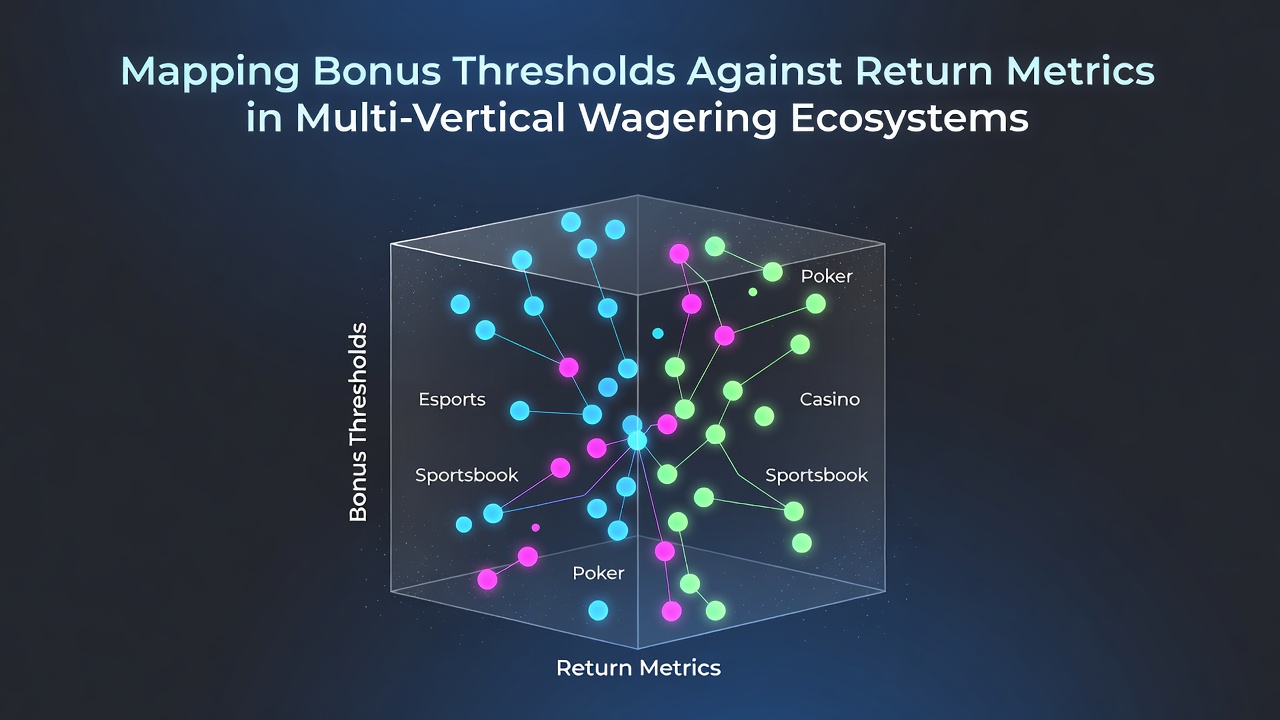
Operators in multi-vertical wagering ecosystems track bonus thresholds against return metrics to balance player incentives with platform profitability, and data from various regulatory frameworks shows how these elements interact across sports betting, casino games, and poker platforms. Thresholds typically define the wagering volume required before bonus funds convert to withdrawable cash, while return metrics encompass metrics like theoretical return to player percentages, hold rates, and expected value calculations that differ sharply between verticals.
Defining Threshold Structures in Diverse Verticals
Bonus thresholds vary by vertical because each carries distinct risk profiles and revenue models, so sports betting often sets lower multiples on odds-based wagers whereas slots impose higher playthrough requirements tied to their fixed RTP ranges. Researchers at institutions tracking global gaming patterns note that a threshold of 20x on a casino bonus might align with an 96 percent RTP slot, yet the same multiple applied to poker rake would produce different player outcomes due to skill elements and variable hold percentages. Platforms operating across verticals adjust these thresholds dynamically to maintain equilibrium between acquisition costs and long-term retention data.
Multi-vertical operators frequently bundle promotions that cross categories, which means a single deposit bonus might require activity split between sports and casino sections, and analysts examine how such structures affect overall return calculations. Evidence from industry reports indicates that thresholds calibrated too high relative to a vertical's average return metric lead to reduced redemption rates, while lower thresholds paired with high-volatility games can accelerate bonus depletion before players reach payout eligibility.
Return Metric Variations and Their Influence on Threshold Design
Return metrics fluctuate across verticals in ways that directly shape bonus threshold policies, with sportsbooks publishing odds that embed margins between 4 and 8 percent on average while slot RTPs range from 92 to 98 percent depending on jurisdiction and title selection. Poker rooms calculate returns through rake structures rather than house edges, which leads operators to apply distinct threshold formulas that account for player skill variance and tournament payout distributions. Data compiled by the American Gaming Association reveals consistent patterns where vertical-specific return differences drive threshold adjustments that keep promotional costs within projected margins across the full ecosystem.
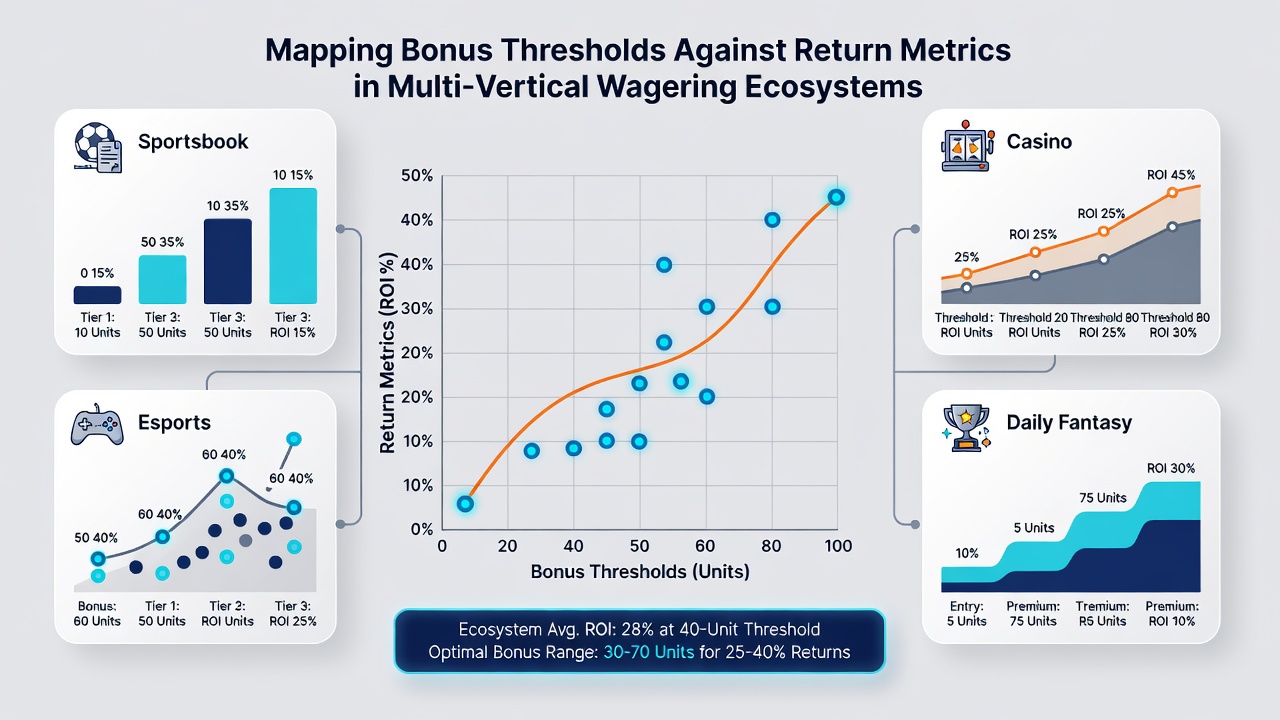
Threshold mapping exercises often plot required wagering volume against expected returns to identify break-even points, and studies from academic gaming research centers demonstrate how a 30x threshold on a live dealer bonus interacts differently with blackjack's lower house edge than with high-volatility progressive slots. Operators monitor these mappings in real time to refine offers, especially as player behavior data from July 2026 shows increased cross-vertical engagement following platform updates that unified bonus ledgers.
Cross-Vertical Mapping Techniques and Practical Applications
Advanced mapping techniques combine threshold data with vertical-specific return metrics into unified dashboards that allow operators to forecast promotional ROI across an entire portfolio, and several major platforms adopted these methods after observing that isolated vertical analysis missed synergies in player migration patterns. One case involved a North American operator that aligned a 15x sports threshold with a 25x casino threshold after modeling showed the combined structure produced stable returns when players alternated between verticals during promotional periods. Such mappings incorporate variables like game volatility, session length averages, and bonus expiry timelines to generate actionable thresholds rather than uniform rules.
Regulatory environments outside the UK, including those overseen by bodies like the Nevada Gaming Control Board, require transparency around how thresholds relate to advertised returns, which has encouraged more precise mapping practices that disclose expected player outcomes. Industry associations such as the Canadian Gaming Association have documented how operators use these maps to comply with fairness standards while optimizing bonus structures, and reports indicate that thresholds calibrated against aggregated return metrics across verticals reduce compliance issues compared with single-vertical approaches.
Conclusion
Mapping bonus thresholds against return metrics provides operators in multi-vertical wagering ecosystems with a framework for aligning incentives across sports, casino, and poker offerings while maintaining sustainable economics. Continued refinement of these models, supported by data from diverse regulatory and research sources, enables platforms to respond to evolving player behaviors and jurisdictional requirements without disrupting overall return structures.