The Dynamics of Return Rates and Risk in Interconnected Slot Games from Diverse Providers
Written by Tina Schwarz · Jun 29, 2026
The Dynamics of Return Rates and Risk in Interconnected Slot Games from Diverse Providers
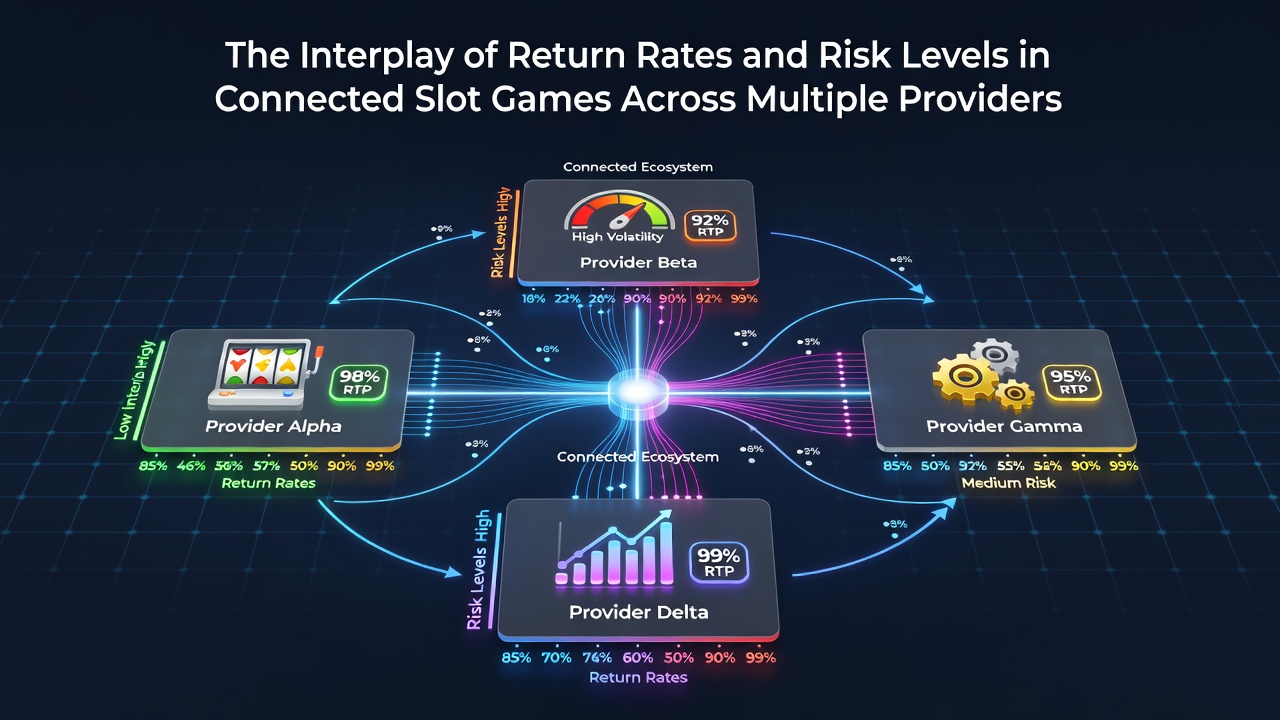
Connected slot games link multiple titles through shared jackpot pools and progressive systems, which creates unique patterns where return rates interact directly with risk levels across providers such as NetEnt, Playtech, and IGT. Research indicates that these networks distribute winnings through centralized mechanics while each developer maintains distinct RTP configurations that range from 94 percent to 98 percent depending on the jurisdiction and game design. Data from industry reports show that volatility, measured through standard deviation of payout distributions, often rises when games tie into cross-provider progressives because larger prize pools introduce infrequent but substantial payouts that shift overall risk profiles.
Core Mechanics of RTP in Networked Slot Systems
Return to player percentages in connected environments operate on algorithms that allocate portions of each wager to both base game outcomes and shared prize contributions, and this structure means a single spin can influence RTP calculations across an entire network. Studies from the University of Nevada Reno Gaming Research Center reveal that when providers integrate their titles into common pools the effective RTP for individual games can fluctuate by 0.5 to 1.5 percentage points based on jackpot contribution rates. Observers note that higher contribution percentages typically lower the base RTP yet increase the potential for elevated returns during jackpot triggers, which produces a balancing act that players encounter when selecting titles from different suppliers.
Volatility Patterns Across Provider Networks
Risk levels in these interconnected systems emerge from the frequency and size of payouts, while connected mechanics amplify variance because jackpot accumulation draws from multiple player bases simultaneously. Evidence from European gaming association analyses demonstrates that games with medium volatility tend to stabilize when linked to progressive networks since the added jackpot component offsets regular small wins with occasional large distributions. Those who have examined payout logs across providers find that low-volatility titles from one developer can exhibit higher effective risk when paired with high-volatility progressives from another, creating hybrid experiences that depend on the specific network configuration active in June 2026.
Provider-Specific Influences on the RTP-Risk Relationship
Different developers apply unique mathematical models that shape how return rates and risk levels align within shared ecosystems, and this variation appears clearly when comparing titles from Microgaming versus Aristocrat. Microgaming networks often allocate 1 to 2 percent of wagers to progressive funds while maintaining base RTP figures around 96 percent, whereas Aristocrat structures frequently emphasize steadier base payouts with lower contribution rates that moderate overall volatility. Figures from the Nevada Gaming Control Board indicate that such differences lead to distinct player session outcomes where one provider's connected slots deliver more consistent returns during non-jackpot periods while another's heighten the probability of extended dry spells followed by substantial rewards.
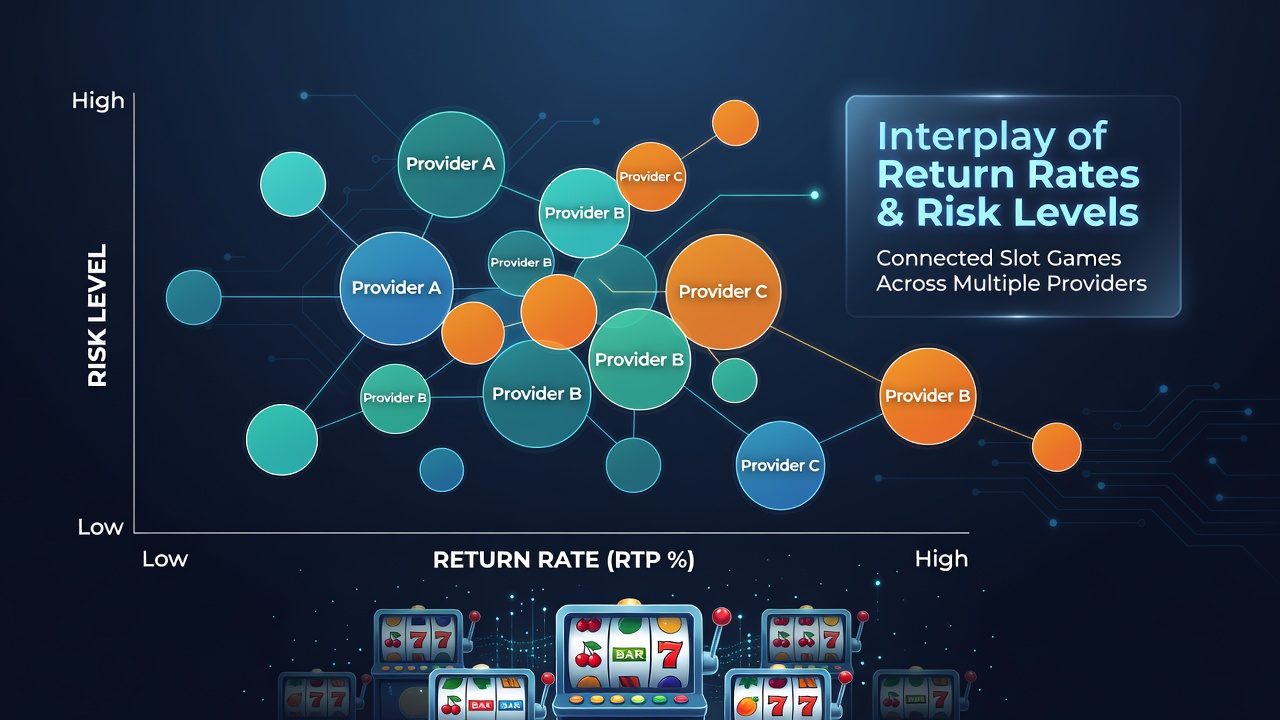
Take one researcher who analyzed multi-provider data sets and discovered that games connected through the same jackpot engine show correlated risk spikes during peak contribution periods, which occurs because increased network activity accelerates prize growth and thereby elevates the standard deviation of returns. This correlation holds across regions where regulatory frameworks permit shared pools, and it explains why operators adjust stake limits and game weighting to manage exposure.
Data Trends Observed in Mid-2026
Reports compiled through June 2026 highlight that connected slot networks experienced a 12 percent increase in average jackpot contributions compared with the prior year, and this growth coincided with refined RTP algorithms that providers implemented to maintain compliance while preserving player engagement. Research indicates that the interplay between return rates and risk has become more pronounced in markets such as Australia and parts of the European Union, where cross-provider linkages now represent over 35 percent of total slot activity according to trade group statistics. Those who've studied these shifts note that providers respond by fine-tuning volatility parameters so that higher-risk titles carry slightly elevated base RTP to offset the added uncertainty introduced by network participation.
Practical Implications for Game Selection and Analysis
Players and analysts examining connected slots across providers benefit from evaluating both published RTP figures and the underlying volatility metrics that determine payout distribution shapes, since the two factors combine to define the overall experience in networked environments. Data shows that titles with RTP above 97 percent paired with medium to high volatility often appear in progressive networks operated by multiple suppliers because the higher return offsets the risk concentration that jackpot mechanics create. What's interesting is how these combinations vary by region, with North American operators favoring structures that emphasize larger but rarer wins while other markets prioritize more balanced distributions within the same connected frameworks.
Conclusion
The relationship between return rates and risk levels in connected slot games continues to evolve as providers refine their integration methods and regulatory environments adapt, and this ongoing development produces measurable differences in how networks perform across suppliers. Comprehensive examination of payout data and mathematical models demonstrates that effective analysis requires attention to both individual game parameters and the collective dynamics introduced by shared jackpot systems. Those monitoring developments through mid-2026 observe steady refinement in these interactions, which supports more precise evaluation of titles regardless of the originating provider.